Page 7 · pictured table
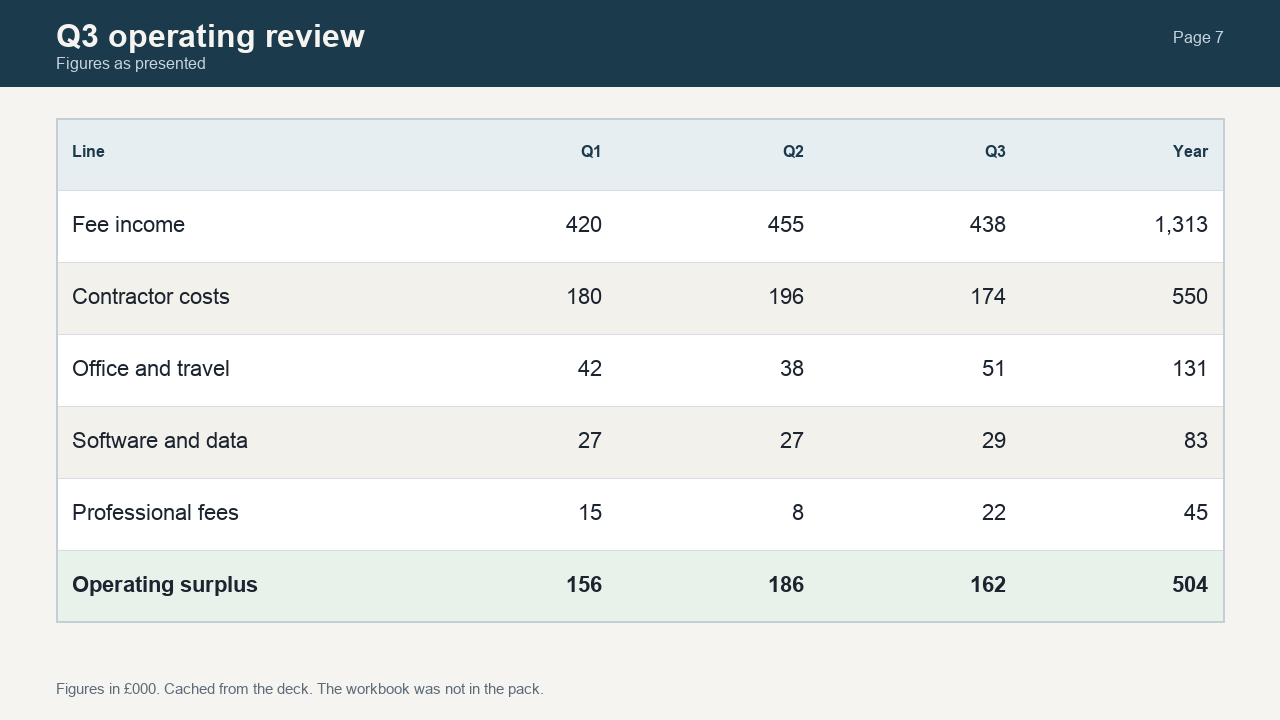
Read back
Workbook was not in the pack
The deck shipped a cached rendering of a linked sheet. Columns come from the right edge of each figure, so the sign stays with its number.
The picture is loaded. The grid is not.
q3-operating-review.csv
Workbook was not in the pack
| Line | Q1 | Q2 | Q3 | Year |
|---|---|---|---|---|
| Fee income | 420 | 455 | 438 | 1,313 |
| Contractor costs | 180 | 196 | 174 | 550 |
| Office and travel | 42 | 38 | 51 | 131 |
| Software and data | 27 | 27 | 29 | 83 |
| Professional fees | 15 | 8 | 22 | 45 |
| Operating surplus | 156 | 186 | 162 | 504 |
Figures in £000, same order as the slide. Footnote ligature execuBve repaired to executive. The grid itself had no broken glyphs.
Each year cell is the three quarters added again, away from the deck. Surplus is fee income less the four cost lines.
q3-operating-review.csv · re-added
| Line | Q1 + Q2 + Q3 | Year on the slide | Check |
|---|---|---|---|
| Fee income | 1,313 | 1,313 | Adds up |
| Contractor costs | 550 | 550 | Adds up |
| Office and travel | 131 | 131 | Adds up |
| Software and data | 83 | 83 | Adds up |
| Professional fees | 45 | 45 | Adds up |
| Operating surplus | 504 | 504 | Adds up |
Font repair on the footnote
The cache draws “ti” as one glyph. The footnote arrived as execuBve and was written as executive. Figure columns were not touched.
Cells that differ
0
Travel in Q3, then the totals
Cells that match
0
Out of 24 figure cells
Source kept
The deck
What was actually presented
Office and travel was 51 on the slide and 48 in the workbook
| Line | Column | On the slide | In the workbook | Kept |
|---|---|---|---|---|
| Office and travel | Q3 | 51 | 48 | Slide |
| Office and travel | Year | 131 | 128 | Slide |
| Operating surplus | Q3 | 162 | 165 | Slide |
| Operating surplus | Year | 504 | 507 | Slide |
The year and the surplus move because Q3 travel moved. Until someone accepts the workbook, the CSV stays with the deck.