Studio map
Tools · 5 nodes · open
An editor and public viewer for diagrams that connect technologies, tools and decisions, with pan, zoom and a detail panel.
Maps of how systems relate were static pictures. They could not be filtered or searched, and nobody could keep them up to date without redrawing. A decision branch was just another arrow, so the yes and no paths were left to the reader's guess.
Editors place boxes on a drawing canvas, drag from the edges to make curved connections, and mark a connection as a yes or no decision. Diagrams, boxes and links are stored in a database. Visitors browse thumbnails, filter by category, and open a diagram with pan, zoom and a detail panel.
Interactive preview with sample data. Nothing is sent to a server.
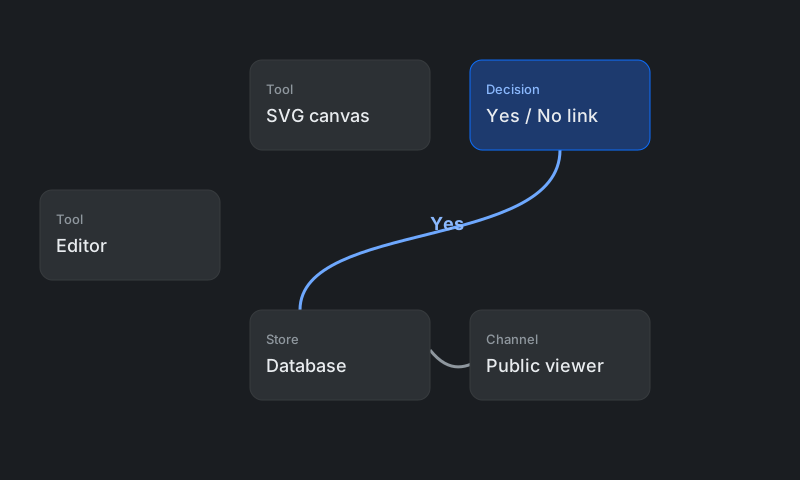
Same five nodes. The decision link is still labelled Yes.
| Title | Type | Category |
|---|---|---|
| Editor | Tool | Studio |
| SVG canvas | Tool | Studio |
| Yes / No link | Decision | Studio |
| Database | Store | Published |
| Public viewer | Channel | Published |
From the decision node into the database. The canvas updates when you change this.
Tools · 5 nodes · open
Operations · decision on the gate
Web · local folder to remote folder
| Diagram | Who | When |
|---|---|---|
| Studio map | Editor | Today |
| Hire path | Visitor | Yesterday |
| Publish delta | Visitor | 8 Oct 2026 |
flowchart LR
  A[Editor sign-in] --> B[Place nodes]
  B --> C[Curved links]
  C --> D[Decision label]
  D --> E[Save]
  E --> F[Public viewer]
  F --> G[Pan zoom and detail]